top of page
B.A.S.
Results & Reports
B.A.S. compiles a customized input/output report based upon the selections in the following form:

Select this icon for a sample (pdf) B.A.S . report >
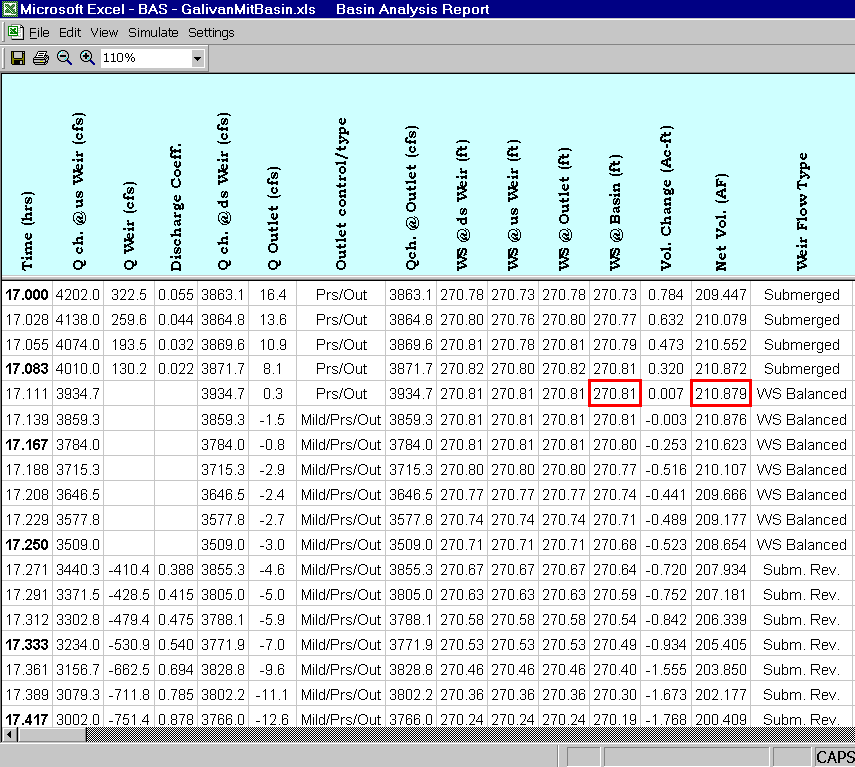
The following are two screen images of the results of the basin analysis run. This particular hydrograph is a 29 hour storm and only about 30 minutes are displayed. The remainder can be viewed in the above pdf sample report.

This graph provides the input (upstream of weir) and the resulting hydrograph (downstream of weir)

BAS has the capability of providing the various hydraulic functions during the storm. For example, below are only 3 such interactions. For a full viewing of the other interactions, please see the pdf report noted above.


bottom of page
